All projects
Inventory Management · 2024
Inventify
See what's selling, what's stuck, and where money is made or lost.
Visit website- Our role
- Design & Development
- Duration
- —
- Industry
- Retail
The challenge
Retailers and distributors were juggling spreadsheets and scattered reports to see stock status, sales performance, and where money was being made or lost.
The approach
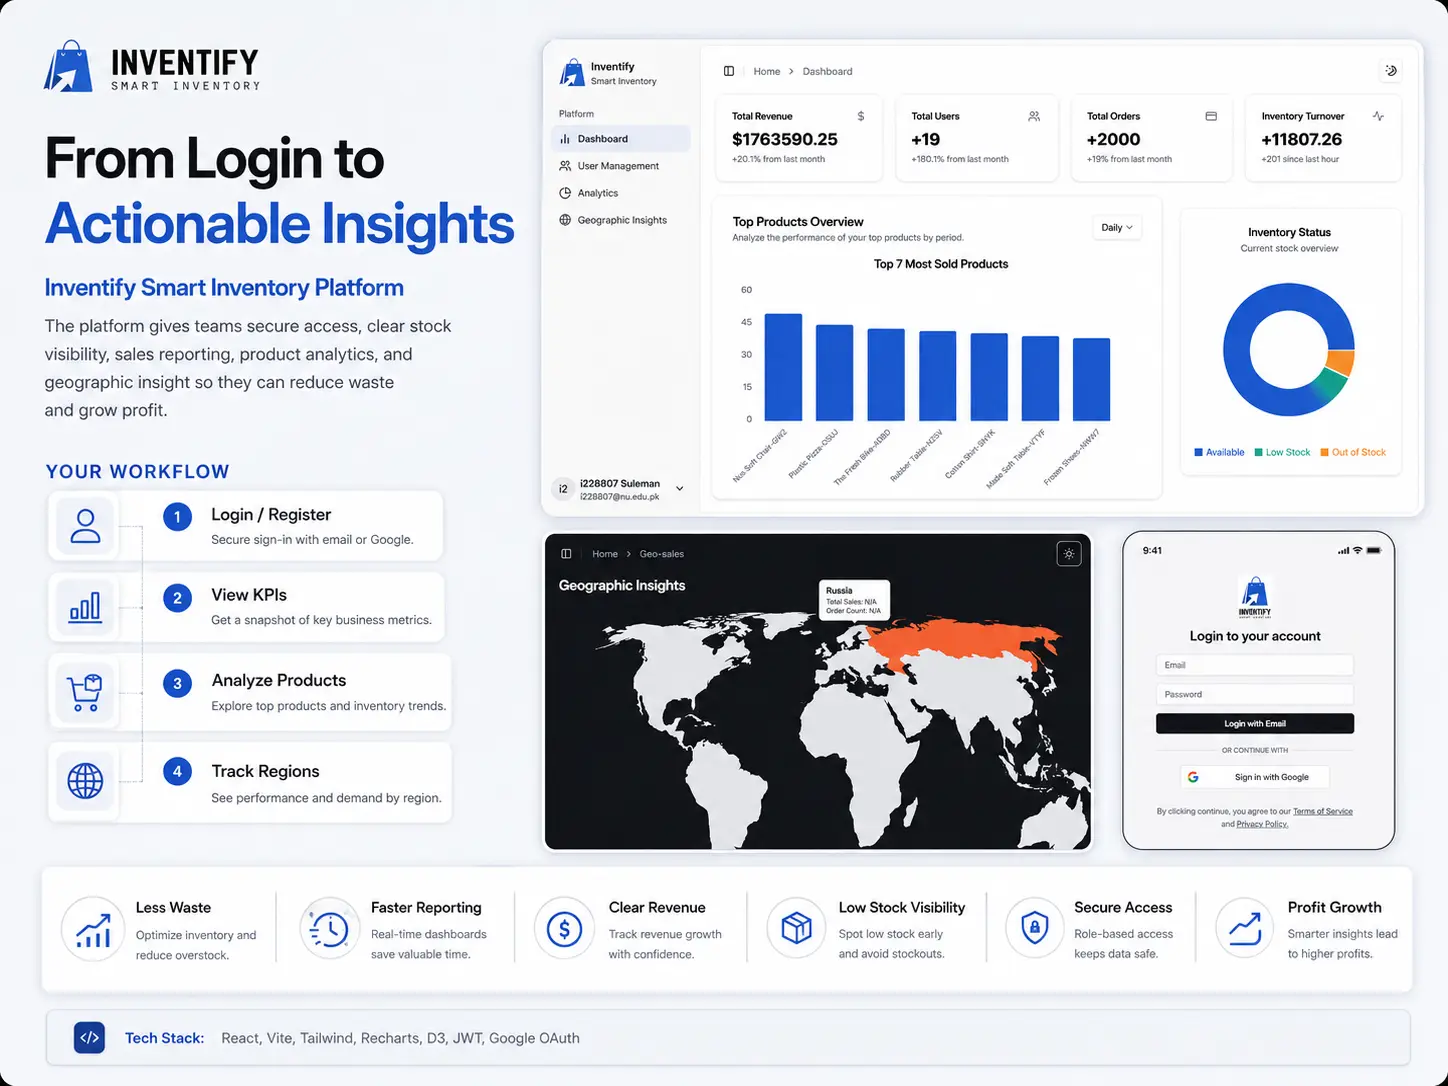
Built a dashboard for KPIs, inventory status, sales performance, revenue insights, product analysis, and regional sales views — with Recharts, D3 geo maps, JWT and Google sign-in, and printable analytics reports.
Inside the platform
- · KPI dashboard
- · Inventory status
- · Sales performance
- · Revenue insights
- · Product analysis
- · Regional sales views
- · User management
- · Printable analytics reports
Gallery
Outcomes
- · Better stock visibility so low stock and slow movers are spotted early
- · Clearer sales and revenue insights for smarter ordering decisions
- · Faster reporting without manual spreadsheet work
- · Geographic sales clarity across strong and weak regions
- · Secure team access with login, registration, and Google sign-in